Eyes Openers
  • World News
  • Business
  • Stocks
  • Politics
  • World News
  • Business
  • Stocks
  • Politics

Eyes Openers

Category:

Stocks

Three Charts To Watch For An “All Clear” Signal
Stocks

Three Charts To Watch For An “All Clear” Signal

by May 7, 2025

With all eyes and ears on this week’s Fed meeting, it’s worth taking a big step back to reflect on conditions related to momentum, breadth, and leadership.  And while the rally of the early April lows has been significant, the S&P 500 and Nasdaq 100 now face considerable resistance at the 200-day moving average.

With that backdrop in mind, here are three charts we’re watching that have not yet signalled an “all clear” for risk assets.

Our Market Trend Model Remains Medium-Term Bearish

Long-time market newsletter author Paul Montgomery used to point out that the most bullish thing the market can do is go up.  The way we make this simple assessment of market trend is using our Market Trend Model.  

As of last Friday’s close, our Market Trend Model shows a short-term bullish signal given the strength off the early April low.  The medium-term model, however, remains bearish as the recent bounce is still defined as a bear market rally.  If the S&P 500 can push above its own 200-day moving average, that would likely be enough to move the medium-term model to the bullish side for the first time since October 2023.

Over the years, I’ve found the Market Trend Model to be a fantastic way of separating the short-term “flickering ticks” of day-to-day market movements from the more significant shifts in sentiment from bullish to bearish.  And by staying on the right side of this model, I’ve been able to capture most of the market upside, and more importantly, avoid disastrous bear phases!

Don’t miss our daily market recap show, CHART THIS with David Keller, CMT.  We’ll track how these charts evolve through the course of the week, highlight key stocks on the move, and boil down the most important market themes from a technical perspective.  Join us live every trading day at 5pm ET, or catch the replay on our YouTube channel!

Will Key Stocks Breakout Above the 200-Day?

While the S&P 500 and Nasdaq 100 are testing their own 200-day moving averages, many S&P 500 members are in a very similar position.  At the April 2025 market low, less than 10% of the S&P 500 stocks were above their 50-day moving average.  That reading has reached almost 60% this week as literally half of the S&P 500 members have regained this short-term moving average.

While the bottom panel shows the percent of stocks above the 50-day moving average, the next panel up displays the percent of S&P 500 members above their 200-day moving average.  While this has also increased over the last month, it still remains below 50%.  

The countertrend rally in March 2025 saw this indicator go up to the 50% and then reverse lower, providing a warning sign of further lows to come.  Will we see a similar stall in this indicator in May 2025?  If so, that could indicate a retest of the April low.  On the other hand, if both of these gauges push above 50%, then investors should brace for much further upside for the S&P 500.

Offense Needs to Dominate Defense

Leadership themes could become incredibly important, as many leading growth stocks remain in a position of technical weakness.  And unless the top growth stocks go into full rally mode, it’s hard to imagine meaningful upside for the S&P 500 and Nasdaq 100.  One way to consider this relationship is to chart the ratio between Consumer Discretionary and Consumer Staples.

The top panel shows the cap-weighted sector ETFs, and the bottom panel shows the same ratio using equal-weighted sector ETFs.  Both of these ratios made a major peak in Q1 2025, and both of them trended lower into a mid-April low.  Over the last three weeks, we’ve seen a dramatic upside reversal in these offense-defense rations, indicating a rotation from defensive to offensive positioning.

Quite simply, I don’t see the major averages pushing higher unless these ratios continue to gain ground to the upside.  We have observed strength in some Consumer Staples names, from Kroger (KR) to Coca Cola (KO), but it would take charts like Amazon (AMZN) making a significant move higher to give the S&P 500 any real chance of pushing above its own 200-day moving average.  This ratio moving higher would confirm that “things you want” are outperforming “things you need”, and that has bullish implications for risk assets.

Investors are facing more uncertainty than ever as we brace for the latest Fed announcement, the newest tariff headline, and mixed results in the form of economic indicators.  By watching charts like these, and keeping a watchful eye on the updated Market Summary page, StockCharts users can approach these markets with confidence.

RR#6,

Dave

PS- Ready to upgrade your investment process?  Check out my free behavioral investing course!

David Keller, CMT

President and Chief Strategist

Sierra Alpha Research LLC

marketmisbehavior.com

Disclaimer: This blog is for educational purposes only and should not be construed as financial advice.  The ideas and strategies should never be used without first assessing your own personal and financial situation, or without consulting a financial professional.  

The author does not have a position in mentioned securities at the time of publication.    Any opinions expressed herein are solely those of the author and do not in any way represent the views or opinions of any other person or entity.

May 7, 2025
Fed Watch: Key Bullish Patterns in the S&P 500, Utilities, and Crypto
Stocks

Fed Watch: Key Bullish Patterns in the S&P 500, Utilities, and Crypto

by May 7, 2025

The S&P 500 ($SPX) wrapped up Tuesday just below its intra-day midpoint and posted one of the narrowest ranges we’ve seen in the past two months. That’s a clear sign traders are reluctant to take major bets ahead of Wednesday’s 2:00 PM ET Federal Open Market Committee (FOMC) decision.

And honestly, this caution makes sense.

If we look back at how the stock market has reacted following the first two FOMC meetings of 2025, there has been a mix of hesitation and sharp moves. Below is an updated chart marking each FOMC date since 2024 alongside the S&P 500. After the late January meeting, the S&P 500 zig-zagged to marginal new highs over the next two weeks before the first of two sharp down legs unfolded.

FIGURE 1. FOMC DATES SINCE 2024.

Coincidence or not, the S&P 500 is trading at nearly the same price level now, six weeks later, as it was back then. So, how close are today’s prices compared to the close on March 18, the day before the last Fed meeting?

This close (see chart below):

FIGURE 2. THE S&P 500 IS TRADING VERY CLOSE TO LAST FOMC MEETING LEVELS.

The difference is that the index has been rallying for four weeks, starting from the pivot low on April 7, a month ago today. In March, the S&P 500 was trying to bounce after topping four weeks earlier on February 19. That bounce continued for a few more days before dominant down-trending price action took over.

But over the last few weeks, the dominant trend is definitely higher. So the big question now is: can this mini uptrend resume after this pause?

A Short-Term Setup to Watch

A few days ago, the 14-period relative strength index (RSI) on the two-hour chart grazed the 70-overbought level for the first time since late January (see chart below). Yes, it took a nearly 18% rally in a very short time frame for it to finally happen, but remember, the indicator was coming off its lowest level since the COVID lows. Modest 3–5% pops were enough to trigger overbought readings for much of 2024. Not this time.

As you know, overbought conditions never persist, especially in very short time frames like this. However, if this rally has anything left in the tank, we’ll see the indicator hit overbought again soon. That may not happen in the next day or two, but if the market reacts negatively to today’s news, but then a bid returns soon after, it could keep some of the bullish patterns we’ve been tracking in play. That’s just one scenario, but one we’ll be closely watching.

FIGURE 3. TWO-HOUR CHART OF THE S&P 500.

Bullish Patterns Still Intact

There are two bullish pattern breakouts still in play on the S&P 500 chart:

Inverse Head and ShouldersCup With Handle

And barring a very extreme and negative reaction, the patterns will stay alive today, as well.

FIGURE 4. INVERSE HEAD AND SHOULDERS AND CUP WITH HANDLE PATTERNS.

FIGURE 5. INVERSE HEAD AND SHOULDERS PATTERN IN THE S&P 500.

FIGURE 6. CUP WITH HANDLE PATTERN IN THE S&P 500.

A Bright Spot: Utilities

The Utilities Select Sector SPDR Fund (XLU) was the first sector ETF (and one of the first of all the ETFs we track) to notch a new 50-day high, which it hit on Tuesday. On the weekly chart, it’s clear the ETF is now trying to leverage a multi-month bottoming formation

This is especially notable because the formation has developed above two bullish pattern breakouts from 2024. Ironically, XLU’s first major breakout of 2024 happened around this time last year (late April), which set the stage for an extremely strong run, at least through late November.

The current snapback is important to watch, given how well XLU has recently capitalized on bullish breakouts. Some upside follow-through from here would also put the former highs back in the crosshairs.

FIGURE 7. WEEKLY CHART OF UTILITIES SELECT SECTOR SPDR (XLU).

Invesco Solar (TAN) Still Has Work to Do

Invesco Solar ETF (TAN) has been rallying since the April lows, much like nearly every ETF we track. On the daily chart, it’s been trying to leverage a bullish cup and handle pattern, a formation we’ve also seen emerge in many other areas. It’s coming off an extremely oversold condition, with its 14-week RSI undercutting 30 for just the third time since 2021. So, TAN could see some additional upside from here. 

But the ETF will need to do much more to materially improve its long-term technical picture. Nearly every rally has stalled near the key weekly moving averages, all of which continue to slope lower. Selling strength in TAN has been a highly effective strategy since it peaked in early 2021.

FIGURE 8. WEEKLY CHART OF INVESCO SOLAR ETF (TAN).

Bitcoin Holding Up

Bitcoin has held its breakout from two weeks ago quite well so far. The next upside target remains near 103k. Again, regardless of whether or not you follow crypto, seeing the bid continue is a bullish sign for risk appetite across different asset classes, especially equities.

Fun fact: Bitcoin topped a few weeks before the SPX so it can be a useful leading indicator.

FIGURE 9. BITCOIN BREAKS OUT.

Ethereum Playing Catch-Up

While Ethereum’s extreme relative weakness vs. Bitcoin has continued, it too has rallied over the last few weeks. It’s now close to breaking out from a cup with handle formation. At the same time, it’s testing its now flat 50-day moving average.

The combination of a bullish breakout and a move through the 50-day moving average produced a very strong follow-through rally in November, something Ethereum will try to replicate.

FIGURE 10. ETHEREUM BREAKS ABOVE 50-DAY MOVING AVERAGE.

Final Thoughts

As we head into the Fed decision, we’re seeing a lot of cautious optimism in the charts. Key bullish patterns are still holding, sectors like Utilities are showing strength, and crypto is flashing green.

The next few sessions will be important. If we get a knee-jerk reaction to the Fed, but buyers step in quickly it could set the stage for the next leg higher in this rally.

Stay alert.

Frank Cappelleri is the founder and president of CappThesis, an independent technical analysis newsletter firm. Previously, Frank spent 25 years on Wall Street, working for Instinet, the equity arm of Nomura and Smith Barney. Frank’s various roles included being an equity sales trader, technical analyst, research sales specialist and desk strategist. Frank holds the CFA and CMT designations and is a CNBC contributor.

https://cappthesis.com

https://www.youtube.com/@cappthesis

https://twitter.com/FrankCappelleri/

https://www.linkedin.com/in/frank-cappelleri-cfa-cmt-a319483/

May 7, 2025
Will Trump’s Foreign Film Tariffs Crush Streaming Stocks? What You Need To Know Now
Stocks

Will Trump’s Foreign Film Tariffs Crush Streaming Stocks? What You Need To Know Now

by May 6, 2025

Trump’s latest Hollywood “hit” isn’t the kind you stream.

Threatening to slap a 100% tariff on films produced in foreign countries, the president’s announcement rattled several media stocks like Netflix, Inc. (NFLX), Walt Disney Co. (DIS), and others.

What makes the whole thing complicated is this:

No clear-cut definition of “foreign”: Many “American” films are shot abroad with foreign crews, locations, and studios.Tax breaks abroad: Studios rely on international incentives to cut costs—think Marvel in the UK or Netflix in Korea (Squid Game).Global revenues: Delivering content overseas boosts subscriptions.Disruption to current projects: In-progress shoots and cross-border production deals could face sudden delays, cancellations, or financial penalties.And last but not least, retaliation risk. Countries may hit back with tariffs or restrictions on U.S. films, hurting global revenues.

The result? A policy that aims to protect American film could end up undercutting it from every angle.

Which Media Stocks Are Still Worth Holding?

With Trump’s proposed 100% tariff and the looming threat of retaliation, you’re probably wondering: Which media stocks are still investable—and which ones are caught in the crossfire?

Let’s focus on the platforms that most Americans stream at home.

Netflix (NFLX) is the most exposed to Trump’s tariffs due to its heavy investment in international productions.Disney (DIS) is most vulnerable both ways—to the U.S. tariff and international retaliation—in that over 60% of its box office revenue is international; plus, it operates theme parks in China, Hong Kong, Japan, and Europe.Roku (ROKU) appears to be the least exposed, as it’s a content aggregator and not a producer. The bulk of its revenue comes from advertising, subscriptions, and platform fees, not from producing or exporting content.

NOTE: I’m excluding Amazon (AMZN) in favor of pure-play media entertainment stocks. While Amazon is not as exposed to foreign film tariffs, it’s exposed to the other tariffs.

First, how are these stocks performing relative to each other and the broader market (S&P 500)?

FIGURE 1. PERFCHARTS DISPLAYING THE RELATIVE PERFORMANCE OF ALL THREE STOCKS VS THE S&P. Netflix is far outpacing its two media peers.

Among these three, which stocks are currently the most investable—that is, which ones are showing favorable price action that could support a viable trading setup?

Netflix Technical Analysis: Uptrend Intact, But Caution Ahead

Let’s start with NFLX—the company most fundamentally exposed to the proposed tariffs on foreign-made films. Check out this daily chart.

FIGURE 2. DAILY CHART OF NFLX STOCK. No tariff fears are evident here as the stock continues its uptrend.

NFLX stock remains in a strong uptrend, with a StockCharts Technical Rank (SCTR) well above the 90-line, making it one of the top-performing large-cap stocks from a technical perspective. However, the Relative Strength Index (RSI) suggests the stock may be overbought, raising the possibility of a short-term pullback.

The  20-day Price Channel can help identify potential turning points since it highlights recent tops and bottoms. The green-shaded zone marks the first area of support, where a bounce may occur if the stock retreats in the coming sessions. If that level fails to hold, the red-shaded zone identifies a secondary support area aligned with the 200-day Simple Moving Average (SMA). A drop below this level without a strong rebound could signal a weakening of the current bullish trend.

Caution: Among the three stocks analyzed, Netflix appears to be most exposed to potential downside from Trump’s proposed tariffs on foreign-made films. Investors should remain cautious, as shifting geopolitical dynamics could alter the stock’s fundamental outlook and technical setup.

Now let’s take a look at Disney, a stock vulnerable to Trump’s proposed 100% tariffs on foreign-made films and the added threat of retaliatory tariffs from international markets.

Disney’s Recovery Potential Faces Global Headwinds

With a significant portion of its revenue coming from global box office sales and international theme parks, DIS stock is particularly sensitive to shifts in global trade policy. Take a look at this daily chart.

FIGURE 3. DAILY CHART OF DISNEY STOCK PRICE. Oof. Even if it recovers, will we see a breakout beyond the top range?

Disney is underperforming, and the key question is whether the stock is entering a potential recovery phase. The Full Stochastics Oscillator tends to mirror the stock’s cyclical movements well and suggests a possible short-term pullback.

If DIS holds above its most recent swing low support range (highlighted in red), the stock may attempt to retest the resistance area (highlighted in green), which aligns with the 200-day SMA and the most recent swing high.

One bullish signal to note: the Accumulation/Distribution Line (ADL) (shown in orange) is significantly above current price levels, suggesting that buying interest may be quietly building even while the stock trades near its lows. Is DIS a solid buy? Probably not at these levels. You will want to see a stronger indication (or confirmation) that DIS is recovering.

Also, note that DIS has been cycling the $80 to $125 range over the last three years. Unless you’re holding it as a dividend stock, there’s little indication yet that there’s going to be growth beyond this exceedingly wide range.

Is Roku Ready to Break Out, or Break Down?

Let’s analyze the daily chart of Roku.

FIGURE 4. DAILY CHART OF ROKU STOCK. It’s gearing for a breakout, but driven by what?

ROKU may be the least exposed to the proposed foreign film tariffs, but what’s going to drive it higher? Remember, the stock plunged in 2022–2024 due to falling ad revenue, widening losses, and a high-profile cybersecurity breach that shook investor confidence. Without a clear reason for a rebound, the stock may remain stuck.

The Chaikin Money Flow (CMF) is probably the most telling indicator here: buying and selling pressure are at a virtual standstill. There has to be a compelling catalyst to move the stock higher or lower. Still, ROKU appears to be rebounding from a technical standpoint, with overhead resistance levels at $71 and $82.

However, there needs to be something fundamental to validate this technical setup, especially if it turns bullish (like a break above resistance). So if for any reason you’re bullish on ROKU, monitor the fundamental side of this stock play. Right now, it doesn’t look very promising.

At the Close

Trump’s proposed tariff on foreign-made films has stirred up more than just Hollywood headlines; it’s forcing Wall Street to reassess risk across streaming and media stocks. Keep monitoring the technical, fundamental, and geopolitical factors. Don’t make any decisions until you see clear technical confirmation backed by a viable fundamental catalyst. And remember, geopolitical dynamics can still shift the conditions in an instant.

Disclaimer: This blog is for educational purposes only and should not be construed as financial advice. The ideas and strategies should never be used without first assessing your personal and financial situation, or without consulting a financial professional.

May 6, 2025
Four Charts to Track a Potential Market Top
Stocks

Four Charts to Track a Potential Market Top

by May 6, 2025

In this video, Dave reveals four key charts he’s watching to determine whether the S&P 500 and Nasdaq 100 will be able to power through their 200-day moving averages en route to higher highs. Using the recently updated StockCharts Market Summary page, he covers moving average breadth measures, his proprietary Market Trend Model, offense vs. defense ratios, and the Bullish Percent Indexes.

This video originally premiered on May 5, 2025. Watch on StockCharts’ dedicated David Keller page!

Previously recorded videos from Dave are available at this link.

May 6, 2025
The Best Five Sectors, #18
Stocks

The Best Five Sectors, #18

by May 5, 2025

Communication Services Drops to #5

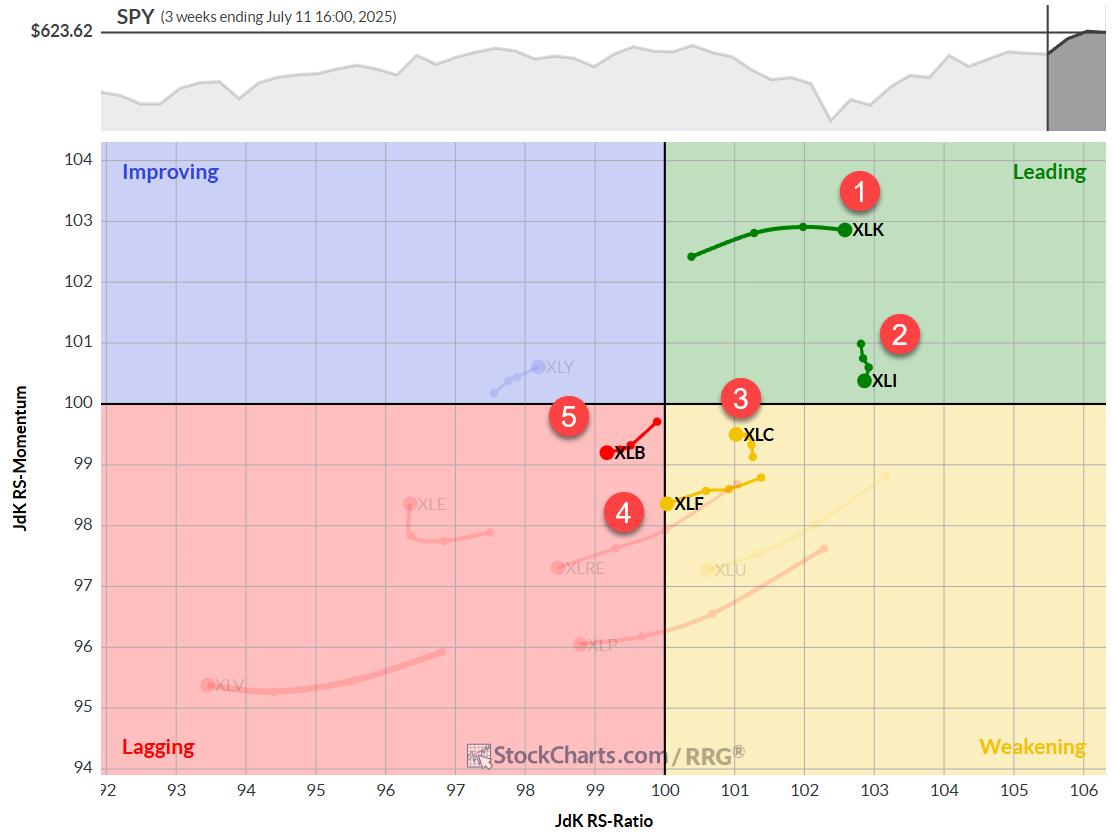
The composition of the top five sectors remains largely stable this week, with only slight adjustments in positioning. Consumer staples continue to lead the pack, followed by utilities, financials, real estate (moving up one spot), and communication services (dropping to fifth). This defensive lineup persists despite a rallying market, presenting an interesting dilemma for sector rotation strategies.

(1) Consumer Staples – (XLP)(2) Utilities – (XLU)(3) Financials – (XLF)(5) Real-Estate – (XLRE)*(4) Communication Services – (XLC)*(6) Healthcare – (XLV)(7) Industrials – (XLI)(8) Materials – (XLB)(11) Technology – (XLK)*(10) Energy – (XLE)(9) Consumer Discretionary – (XLY)*

Weekly RRG

The weekly Relative Rotation Graph (RRG) paints a picture of potential change on the horizon.

While staples, utilities, real estate, and financials maintain their positions in the leading quadrant, they show signs of losing relative momentum over the past few weeks.

Financials, particularly, are teetering on the edge of rolling into the weakening quadrant.

Communication services have already shifted, now firmly in the weakening quadrant and traveling on a negative RRG heading. This movement explains its drop to the fifth position in our sector rankings.

Daily RRG

Switching to the daily RRG, we see a slightly different picture for our top sectors.

Staples, utilities, real estate, and financials are all positioned in the weakening quadrant, traveling on negative RRG headings.

This short-term view indicates that we must closely monitor these sectors to determine if they can regain momentum before potentially dropping out of the top five.

Interestingly, communication services is showing signs of life on the daily chart. Despite falling to the fifth position overall, its tail is now in the improving quadrant and moving toward leading.

The caveat? It’s a very short tail, close to the benchmark—essentially moving in line with the market. This makes communication services the sector most at risk of losing its top-five status in the near term.

Consumer Staples

Consumer staples is bumping up against overhead resistance between $82.50 and $83.

This hesitation in upward price movement is causing weakness in the RS line, which has started to dip.

Consequently, the RS momentum line is rolling over. However, the high RS ratio—indicating a strong relative trend—is keeping staples at the top of our list for now.

Utilities

Utilities has been flirting with a breakout since the start of 2025, pushing against overhead resistance around $80 about four times already.

When it breaks, we’ll likely see an acceleration towards the all-time high just above $82.50.

Like staples, the inability to break resistance is causing a stall in the RS line and a rollover in relative momentum.

Financials

After a strong rally off the $42 support level, previously resistance (the old technical adage holds true), financials is now facing a challenge.

The rally is approaching the former rising support level that marked the uptrend channel. This could cause some hesitation in both price and relative strength.

The RS line remains within its rising channel, but momentum has waned, causing the green RS momentum line to roll over.

Real-Estate

Real estate moved up one position to fourth and is still emerging from a long relative downtrend that began in April 2022.

The RS ratio line has picked up the relative strength rally that started in early 2025 but is now stalling.

This has resulted in the green RS momentum line rolling over. On the price chart, real estate is mid-range with room to move higher.

Communication Services

Communication services have dropped to the fifth position, but the price chart has an interesting development.

Last week, the price broke back above the old neckline of a small head-and-shoulders pattern. The fact that we’re now rallying above this neckline could indicate a failed head-and-shoulders pattern—usually a very strong bullish sign.

However, recent weakness in relative strength has pushed the sector deeper into the weakening quadrant on the RRG.

This sector must pick up rapidly in the coming weeks to maintain its position in the top five.

Portfolio Performance

The defensive positioning of our top five sectors is leading to underperformance as the broader market rallies.

Currently, we remain at approximately a 3% underperformance compared to SPY just like last week.

However, from the perspective of sector rotation, we must still consider this rally in the S&P 500 to be temporary.

The underlying message continues to emphasize defense.

It’s important to remember that there is always a lagging element in RRGs and this strategy.

If the market has truly turned, we will see that shift reflected in our sectors, and at some point, we will start to make up the difference.

These performance gaps can change very rapidly in favor of the RRG portfolio when the market comes under pressure and our defensive sectors start to lead again.

#StayAlert and have a great week — Julius

May 5, 2025
Two Down and Two to Go – Capitulation and Thrust are just a Start
Stocks

Two Down and Two to Go – Capitulation and Thrust are just a Start

by May 3, 2025

The market does not always follow the same script or sequence, but bear markets end with a bottoming process marked by specific stages. These include capitulation, a short-term reversal-thrust, a follow-through thrust and long-term regime change. The first two stages mark downside excess and the initial turn around, while the latter two signal strong follow through. Today’s report will look at the first two phases, and preview the last two

Phase 1: Capitulation

The capitulation phase of a bear market occurs when traders throw in the towel. Downside momentum and selling pressure accelerate. Usually, the capitulation phase occurs after an extended decline, and this phase is the first step to a bottom. The chart below shows SPY with Bollinger Bands (200,3), %B (200,3) and S&P 500 Percent Above 200-day SMA ($SPXA200R). Signs of capitulation emerge when %B is below 0 and/or fewer than 20% of S&P 500 stocks are above their 200-day SMAs. The blue dashed lines show capitulation in June 2022, September 2022 and early April 2025. Note that we initially covered this capitulation phase in a report on April 8th.

Phase 2: Short-term Thrust Signals (ZBT)

Thrust signals trigger when there is an upside “thrust” from an oversold extreme. The Zweig Breadth Thrust is perhaps the most famous thrust indicator these days. We covered the ZBT extensively over the last few weeks and introduced a strategy using this indicator. The chart below shows the S&P 1500 ZBT indicator in the lower window (10-day EMA of S&P 1500 AD%). A thrust signal triggered on April 24th and stocks followed through with further gains.  

Two Down and Two to Go

The capitulation phase showed excessive selling pressure and the thrust phase marked a short-term reversal. These are bullish events, but the market cup is not yet half full. SPY remains below its 200-day SMA and the late March high (see chart above). Medium-term thrust indicators have yet to trigger and long-term breadth remains bearish. The 14% surge over the last 17 days is impressive, but keep in mind that SPY surged 10% in nine days in March 2022, which was a bear market bounce.

TrendInvestorPro produced a report this week covering the four phases – and what to watch going forward. Click here to take a trial and get immediate access.

Phase 1: CapitulationPhase 2: Short-term Thrust SignalsPhase 3: Medium-term Thrust SignalsCapitulation and Thrust IndexesPhase 4: Long-term Indicators turn BullishShort-term Improvements, but Longer Term 

//////////////////////////////////////////////////////

May 3, 2025
Week Ahead: While NIFTY Continues To Consolidate, Watching These Levels Crucial
Stocks

Week Ahead: While NIFTY Continues To Consolidate, Watching These Levels Crucial

by May 3, 2025

In the truncated week due to one trading holiday, the markets extended their gains and closed the week on a positive note. While remaining largely within a defined range, the Nifty continued consolidating above its 200-DMA while not adopting any sustainable directional bias. While the Index continued defending its key support levels, it oscillated in the range of 535.10 points. Volatility continued moving higher; the India Vix surged by 6.41% to 18.26 on a weekly basis. While staying positive, the headline index closed with a net weekly gain of 307.35 points (+1.28%).

From a technical standpoint, the Nifty has kept its underlying bias intact; it is currently consolidating above the 200-DMA positioned at 24050. The 50-week MA is placed at 23962. This makes the 24950-24050 a strong 200-point support zone for the Nifty for the coming weeks and the foreseeable short term. So long as the Index keeps it above this 200-point support zone, it will just consolidate and not show any major drawdowns. However, any violation of 24900 will increase the possibility of some corrective retracement. Watching Nifty’s behavior vis-à-vis the zone of 23950-24050 would be crucial over the coming days.

The geopolitical tensions between India and Pakistan remain ingrained in the market behavior; the rise in Vix shows increased hedging activity by the market participants. Monday is likely to see a stable start to the day; the levels of 24550 and 24780 are likely to act as resistance levels. The supports come in at 24050 and 23900. The trading range is expected to stay wider than usual.

The weekly RSI stands at 57.92. While the RSI has formed a fresh 14-period high, it remains neutral and does not show any divergence against the price. The weekly MACD is bullish and trades above its signal line.

The pattern analysis shows that on the daily chart, the Nifty crossed above the 200-DMA a few days ago; now, it is consolidating just above this important level. It has penetrated the 50-week MA placed at 23962, and this level is now expected to act as support in the event of any corrective retracement. Importantly, the Nifty has resisted the rising trendline pattern resistance near 24600. This trendline begins at 21130 levels and joins the subsequent rising bottoms.

The coming week will require a more cautious approach as the markets not only deal with key resistance levels but also with geopolitical tensions that remain embedded in the backdrop. The investors will need to move away from the stocks that have risen over the past weeks and move to those sectors and stocks that are readying for a fresh move. While focusing more on low-beta stocks, the leverage, too, needs to be curtailed. The Index has risen over 2500 points over the past three weeks, and if it consolidates a bit, it should not surprise the market participants. A highly cautious and stock-specific approach is advised for the coming week.

Sector Analysis for the coming week

In our look at Relative Rotation Graphs®, we compared various sectors against the CNX500 (NIFTY 500 Index), which represents over 95% of the free-float market cap of all the listed stocks.

Relative Rotation Graphs (RRG) show the Nifty FMCG index has rolled inside the leading quadrant. The PSU Bank, Infrastructure, and Consumption Index are also inside the leading quadrant. The Metal, Commodities, Financial Services, and Nifty Bank Index are also inside this quadrant, but they are giving up on their relative momentum. However, these groups may continue to outperform the broader markets relatively.

The Services Sector Index has rolled inside the weakening quadrant.

While the Nifty IT index continues to languish inside the lagging quadrant, the Midcap 100, Auto, Realty, and Pharma Indices are seen improving their relative momentum while being inside the lagging quadrant.

The Nifty Media, PSE, and Energy Indices are inside the improving quadrant; they are expected to better their relative performance against the broader markets.

Important Note: RRG™ charts show the relative strength and momentum of a group of stocks. In the above Chart, they show relative performance against NIFTY500 Index (Broader Markets) and should not be used directly as buy or sell signals.  

Milan Vaishnav, CMT, MSTA

Consulting Technical Analyst

www.EquityResearch.asia | www.ChartWizard.ae

May 3, 2025
The Easiest Road to Supercharge Your Investing Reflexes and Reactions!
Stocks

The Easiest Road to Supercharge Your Investing Reflexes and Reactions!

by May 2, 2025

Riches are found in reactions—your reactions to changes in the markets. By this, I mean that if you spot a change in money flowing from one asset class to another, one sector to another, one industry to another, before the masses notice, you will be rewarded handsomely. My experience has been that your profits will accumulate dramatically and consistently.

A fine example of this principle in the corporate arena is the global footwear and accessories retailer, Aldo. The company has 1,600 stores in 80 countries and is immensely profitable. Their secret sauce: quick reactions to market trends. When they identify a change in fashion trends, they’re 50 percent quicker than their competition in designing, producing and delivering the hottest styles. Yes, fifty percent faster, and that’s gold to their bottom line.

This can be your secret sauce to investment profits as well. Your personal portfolio of ChartLists is the equivalent of Aldo’s design department, production department, and delivery department all bundled together. It facilitates quick reactions to current observable stock market opportunities.

In simplistic terms, your personal collection of ChartLists is like giving a runner a bicycle or giving a Jeep driver a Porsche. ROI (return on investment of your time and efforts) becomes supercharged. Your ChartLists allow you to become a “force of consistency.” They will also help you embrace one of Charlie Munger’s key investment tenets, “Try to be consistently not stupid.”

To achieve this end, I humbly suggest that you could best start with the Stock Market Mastery ChartPack.

Assembling your portfolio of ChartLists is analogous to building your custom dream house. There are sensational books of checklists that systematically ask you a comprehensive series of questions and bring up features you should consider. The end result should be a custom home you love, that fits you perfectly, and that accommodates your unique lifestyle. Think of the Stock Market Mastery ChartPack, then, as an extensive checklist—a buffet of pre-populated and organized ChartLists, from which you build your own custom collection of ChartLists that fits your investing methodology perfectly and facilitates your personal Investor Self. These 80 ChartLists are carefully structured, all pre-populated with expertly designed charts and a carefully-crafted organization to maximize your precious time and insights. Indeed, nearly all the informational breadcrumbs the market has to offer will be made clear to you and offer you a profitable trail to follow. Your reflexes and reactions just got supercharged. It is that easy.

Trade well; trade with discipline!

Gatis Roze, MBA, CMT

StockMarketMastery.com

Author, “Tensile Trading: The 10 Essential Stages of Stock Market Mastery” (Wiley, 2016)Developer of the “Stock Market Mastery” ChartPack for StockCharts membersPresenter of the best-selling “Tensile Trading” DVD seminarPresenter of the “How to Master Your Asset Allocation Profile DVD” seminar

May 2, 2025
Three Stocks With Post-Earnings Upside Potential
Stocks

Three Stocks With Post-Earnings Upside Potential

by May 2, 2025

With the major averages logging a strong up week across the board, and with the Nasdaq 100 finally retesting its 200-day moving average from below, it can feel like a challenging time to take a shot at winning charts. You may ask yourself, “Do I really want to be betting on further upside after an incredibly strong April?”

When the macro environment feels less certain, I find it’s helpful to go back to tried-and-true technical analysis approaches. By identifying stocks with constructive chart patterns, we can hopefully focus our attention on names that could do well regardless of the overall market movements in the coming weeks.

With that bottom-up investing justification in mind, let’s review three recent earnings names that are showing strong technical profiles going into next week.

Visa Inc. (V)

Both Visa (V) and Mastercard (MA) reported earnings, and both stocks experienced an upside follow-through after their quarterly report. Visa has been pounding out a consistent pattern of lower lows and lower highs since the end of February, but this week appears to have broken that downtrend pattern.

After Tuesday’s earnings release, Visa completed a move out of the downtrend phase by breaking trendline resistance using the major peaks from February and March. Wednesday’s up day pushed V back above the 50-day moving average, a level which had repelled a previous breakout attempt in mid-April. MA has now broken above its late March high, and a similar move next week would suggest a retest of all-time highs for Visa.

Coca Cola Co. (KO)

The Consumer Staples sector pulled back this week, and leading names in the sector, such as Coca-Cola (KO), experienced a brief drop post-earnings. KO is demonstrating a cup-and-handle pattern, although we’ve not seen the breakout that would serve to confirm a bullish outlook.

We’ve used the Annotations tool to draw a rectangle marking the resistance zone from the September 2024 peak. Subsequent peaks in March and April 2025 have retested this same range, forming the cup-and-handle pattern which often precedes a strong upthrust. The trigger for this pattern is a confirmed break above the rim of the cup, and, with this week’s pullback, investors will have to wait for this bullish confirmation.

We’ve noted the bearish momentum divergence in recent months, with the higher price highs in March and April marked by weaker RSI peaks. With this bearish divergence clearly signalling a weaker momentum profile, we would need to see a valid break above $74 on stronger RSI readings to negate the divergence and confirm an upside breakout.

CME Group Inc. (CME)

Since I discussed the exchanges with Jay Woods on my Market Misbehavior podcast back in February, I’ve been following the resilient uptrend of higher highs and higher lows. The daily chart features a series of consolidation patterns followed by upside breakouts that have led to further gains.

This is the kind of chart that I think about when someone asks, “But if you’re buying the new highs list, isn’t that too late?” The chart of CME shows that new highs often lead to even more new highs. And when a stock like CME Group keeps pulling back to an ascending 50-day moving average, I’m reminded the essence of trend-following is to remain invested in charts that continue to work.

In the immortal words of legendary technical analyst Paul Montgomery, “The most bullish thing the market can do is go up!”

I had the pleasure of heading back into the StockCharts TV studio this week to shoot the “Top Ten Stocks for May 2025” video with Grayson Roze. Visa was one of the five stocks I contributed. Check out the other nine in this week’s video!

RR#6,

Dave

P.S. Ready to upgrade your investment process? Check out my free behavioral investing course!

David Keller, CMT

President and Chief Strategist

Sierra Alpha Research LLC

Disclaimer: This blog is for educational purposes only and should not be construed as financial advice. The ideas and strategies should never be used without first assessing your own personal and financial situation, or without consulting a financial professional.

The author does not have a position in mentioned securities at the time of publication. Any opinions expressed herein are solely those of the author and do not in any way represent the views or opinions of any other person or entity.

May 2, 2025
Stocks In Focus This Week: Palantir, Uber, and Coinbase
Stocks

Stocks In Focus This Week: Palantir, Uber, and Coinbase

by May 2, 2025

This week, we’re watching three high-profile names–Palantir (PLTR), Uber (UBER), and Coinbase (COIN)–as they gear up for earnings. These stocks could offer up some interesting setups with favorable risk/reward entry points. Let’s break down what’s happening with each one.

Palantir (PLTR): Watching for an AI-Driven Breakout

PLTR stock almost got back to its all-time highs after a sell-off that saw the stock price drop by as much as 47% from its February peak. Two key factors will be in focus: AI and government-backed contracts.

Palantir’s Artificial Intelligence Platform (AIP) is a big piece of the puzzle. Analysts anticipate commercial revenue to increase by 35% year-over-year, driven by the company’s efforts to penetrate industries such as healthcare, energy, and finance.

Government contracts account for about 55% of the company’s total revenue. Investor concerns revolve around the ability to secure and maintain these contracts amid potential Department of Defense budget cuts.

FIGURE 1. DAILY CHART OF PLTR STOCK. The stock closed below its all-time high and has a history of big gaps on earnings day.Chart source: StockCharts.com. For educational purposes.

Technically, PLTR stock is at a key inflection point. The stock closed right under its all-time high and has a history of big gaps on earnings day. It traded higher in five of the last six earnings reports, with an average gain of 21%.

Watch the gaps… Gap ups tend to continue in that direction and lead to sustained uptrends. Use any upside gap to enter and manage risk, with stops set to exit if it starts to reverse and fill. A gap in this case, and given its momentum, could see shares eclipse the $150 mark.

On the downside, there are several levels of support. The biggest area is in the purple-shaded area surrounding the 50-day moving average. The $84 area would fill the gap from last earnings and could become a solid floor, going forward.

Either way, it’s a coin flip technically entering earnings, but the next move should set up interesting entry points.

Uber Technology (UBER)

Uber’s stock price has performed extremely well compared to the rest of the market this year. The stock is up 40% year-to-date. As UBER heads into earnings on May 7, expectations are rising. The stock price has already broken out and is trading near all-time highs.

Last quarter’s guidance fell short of expectations. That will be a big focus again. Investors will also be looking to see if UBER can sustain gross bookings numbers. They’re supposed to grow by 17%-21% year-over-year. We may also hear about Uber’s strategic moves in the evolving landscape of autonomous transportation.

FIGURE 2: DAILY CHART OF UBER STOCK. Uber has been trading in a broad range in the past year.Chart source: StockCharts.com. For educational purposes.

Technically, Uber shares have traded in a broad range in the past year. During this time, there was one failed breakdown and one failed breakout. We enter this week’s report on the heels of another breakout.

This could be an example of price leading the news. We will find out when Uber reports on Wednesday morning. An upside target of $100 should be in the cards, with confirmation of this move out of this rectangular neutral trend. If it fails to hold above the $80/$82 level, then a drop to its key moving averages is likely.

While the stock is nearing overbought territory, shares have remained overbought for an extended period during major moves higher. Use any break below 70 in the relative strength index (RSI) to take profits or sell.

Coinbase (COIN): Looking to Break a Losing Streak

Coinbase will be looking to snap a four-quarter losing streak post-earnings when it reports on Thursday. Shares of the cryptocurrency platform have been quite volatile and began the week lower by -16.5% year-to-date.

Investors will be looking for insights into Uber’s ability to capitalize on increased trading volumes, along with any news on plans to diversify revenue streams and strategically position itself within the current regulatory landscape.

FIGURE 3: DAILY CHART OF COINBASE STOCK PRICE. Fibonacci levels help identify areas of interest.Chart source: StockCharts.com. For educational purposes.

Technically, shares have taken quite a ride over the past two years. The Fibonacci extension lines on the chart demonstrate the significance and help identify levels of interest where traders may gain opportunities.

The stock remains in its near-term downtrend going back to its December peak. The floor seems to be established for now, with support levels around $180 and major support by the “golden ratio” around $150. If there is any weakness, then look to these levels to possibly add to the name.

The upside seems more challenging. Shares remain weaker than many of its peers and are still mired in a near-term downtrend with clear resistance around the 200-day moving average at $226. If COIN were to break and close above this threshold, then there is a lot to reverse given a much clearer reward than risk set-up. For now, it’s one to watch to see what price action does when the company reports on Thursday afternoon.

May 2, 2025
  • 1
  • 2
  • 3
  • 4
  • 5
  • …
  • 8

    Get free access to all of the retirement secrets and income strategies from our experts! or Join The Exclusive Subscription Today And Get the Premium Articles Acess for Free

    By opting in you agree to receive emails from us and our affiliates. Your information is secure and your privacy is protected.

    Popular Posts

    • 1

      Bolder maritime security forged by Manila and Seoul for the Indo-Pacific region

      September 24, 2024
    • 2

      Floods in South Asia expose gaps in regional climate cooperation

      October 10, 2024
    • A GOP operative accused a monastery of voter fraud. Nuns fought back.

      October 24, 2024
    • 4

      South Korea court begins review of Yoon impeachment

      December 16, 2024
    • 5

      Bill to rewrite Indigenous rights brings tens of thousands of protesters to New Zealand’s parliament

      November 19, 2024

    Categories

    • Business (220)
    • Politics (20)
    • Stocks (77)
    • World News (20)
    • About us
    • Privacy Policy
    • Terms & Conditions

    Disclaimer: EyesOpeners.com, its managers, its employees, and assigns (collectively “The Company”) do not make any guarantee or warranty about what is advertised above. Information provided by this website is for research purposes only and should not be considered as personalized financial advice. The Company is not affiliated with, nor does it receive compensation from, any specific security. The Company is not registered or licensed by any governing body in any jurisdiction to give investing advice or provide investment recommendation. Any investments recommended here should be taken into consideration only after consulting with your investment advisor and after reviewing the prospectus or financial statements of the company.

    Copyright © 2025 EyesOpeners.com | All Rights Reserved